Introduction
The University of California, Irvine (UCI) is relatively young with the first graduating class in 1966. Today, UCI is acclaimed internationally for its academic strength in energy and environmental studies as well as its operational record in energy efficiency.
As a cornerstone of one of the youngest, largest, and most prestigious planned communities in the country (the City of Irvine), UCI was established on sprawling undeveloped acreage on the bluffs bounding the Pacific Ocean. This allowed the University of California to methodically and systematically design a new campus from scratch. Benefitting from this novel opportunity, the campus was designed around a large, circular central park and a one-mile underground utility tunnel loop on the periphery that houses a central energy and communications infrastructure.
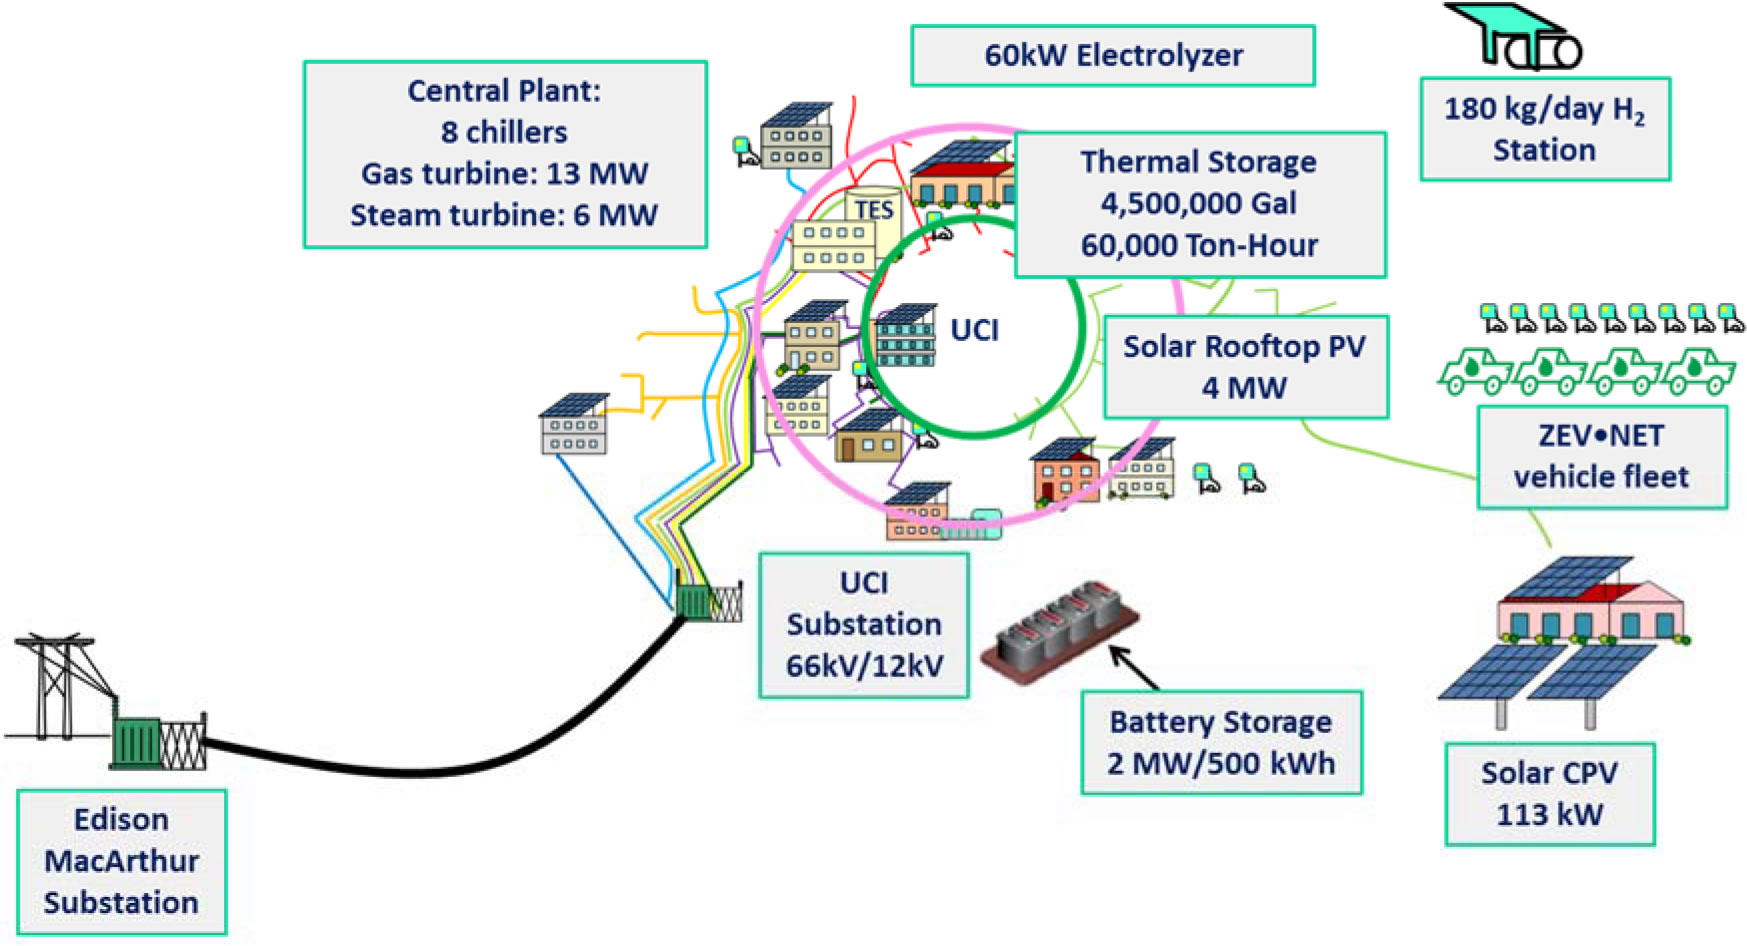
Figure 1: University of California, Irvine Microgrid | Green Ring: Central Park | Purple Ring: Utility Tunnel
The UCI Microgrid is anchored in this tunnel with radial feeds from the tunnel to serve the sprawling campus community (Figure 1). Today, the UCI Microgrid serves a community of more than 30,000 people and encompasses a wide array of building types (residential, office, research, classroom), transportation options (automobiles, buses, shared-cars, bicycles), and a wide array of distributed energy resources. Through an array of prior and current research programs, the UCI Advanced Power and Energy Program (APEP) has teamed and worked with the UCI Administration and Facilities Management (FM) to integrate key microgrid hardware, software, and simulation assets into the UCI
Microgrid.
As shown in Figure 1, the UCI Microgrid is a test bed that (1) is served by Southern California Edison (SCE) through the UCI Substation which steps down voltage from 66kV to 12kV using two 15 MVA transformers, (2) encompasses ten 12kV circuits, (3) includes more than 4 MW of solar power, (4) is served by a 19MW natural gas fired combined cycle plant, (5) incorporates centralized chilling including one of the largest thermal energy storage tanks in the country (4.5 million gallons/60,000 ton-hours), and (6) serves all major buildings with district heating and cooling. The UCI Microgrid also contains a unique set of distributed energy resources that is unparalleled in the world including: (1) electric vehicle
charging at multiple parking locations, (2) hydrogen fueling for fuel cell vehicles, (3) two-axis tracking concentrated solar photovoltaic systems, (4) advanced building energy efficiency measures, (5) advanced building monitoring and control, and (6) advanced power, power quality, and thermal metering.
The following section presents more details of the major hardware assets of the UCI Microgrid. Each of these assets has been inventoried, characterized and modeled. The subsequent section introduces the UCI Microgrid model development and verification via comparison to data acquired by conventional metering deployed throughout the microgrid, and advanced high-resolution and high-response metering at over 100 key locations.
UCI Microgrid Hardware Assets
Substation and Campus Circuits
The electric service for the UCI campus has already experienced a history of change and steady growth that defines its present characteristics. The early campus was served directly from two SCE 12 kV circuits that entered the UCI central plant. Each of these two circuits separated into sub-circuits that fed the portion of campus around the central plant. A third SCE 12 kV circuit fed the East Substation, which was located on the opposite side of campus. This third line also connected to a bus bar that energized more sub-circuits to serve the east side of campus.
In 1990, the UCI Substation was built to accept a SCE 66 kV service directly and step the voltage down to 12 kV locally and thereby displace three legacy circuits. Most buildings in the main UCI campus are still served by infrastructure derivative of these three main circuits. The primary feed for the UCI Substation is an SCE 66 kV line with a single billing meter. The two UCI Substation transformers, which cannot be paralleled, each serve 5 circuits and a capacitor bank. The 12 kV side of the two transformers are connected with a tie-line switch. At present, the two capacitor banks at the UCI Substation are disconnected due to a resonance issue that occurred when the 19MW combined cycle plant was
installed. The turbines associated with the plant generate reactive power to augment this need.
The history and vision of the UCI electric service have already led to a power system that is flexible for modifications. The emphasis on reliability for campus buildings has led most building transformers to have two circuit sources that can easily shift load. The circuits themselves are reconfigurable through existing switches that were installed to meet various stages of the campus growth. In addition, the utility tunnel provides convenient access to re-conductor critical circuits for increased capacity or to use high speed hard-wired fiber optic communications strategies in the future. At present, most 12 kV circuit feeders have available capacity. There are also no exportation limitations for UCI Substation transformers, which would significantly increase the local capacity constraints on any distributed energy resources on the campus. The flexibility elsewhere in the system may improve capacity challenges on the distribution and substation transformers, but these locations are not inherently suited to direct modification.
Central Plant
The UC Irvine Central Plant consists of 8 electric chillers, a steam turbine chiller, a thermal energy storage tank, boilers (used only for backup), a 13 MW gas turbine, a heat recovery steam generator (HRSG), a duct burner, and a 6 MW steam turbine (Figure 2). The central plant serves all the campus heating and cooling loads as well as the majority of the campus electric loads. The 8 electric chillers are capable of supplying 14,500 tons, and the steam driven chiller is capable of an additional 2,000 tons. The campus cooling load averages 3,100 tons (74,400 ton-hours per day) with a peak annual demand of 13,900 tons. The thermal energy storage tank uses a thermocline to minimize mixing. The chillers operate to facilitate this thermocline while also increasing efficiency by recirculating water exiting the chiller back to the chiller inlet until 39?F is maintained at the chilled water exit. The thermal energy storage tank is able to shift, on average, 65% of the chilling load during the day to the night when electricity prices are lower and temperatures are cooler, which results in more efficient chiller operation via better heat rejection through the cooling towers. The campus heating load averages 44 MMBtu/hr with a peak annual demand of 100 MMBtu/hr. The heating load is served entirely through recovered heat from the gas turbine and use of the duct burner. The HRSG can supply 52,000 lbs/hr steam without duct fire and 120,000 lb/hr with duct fire. The campus electric load averages 13.4 MW with a peak
annual demand of 18.6 MW (note: this is the electric load separated from the electricity used to serve the campus cooling loads). The gas turbine and steam turbine supply about 85% of the electrical needs on the campus with the balance being served by solar resources (5%) and utility import (10%).
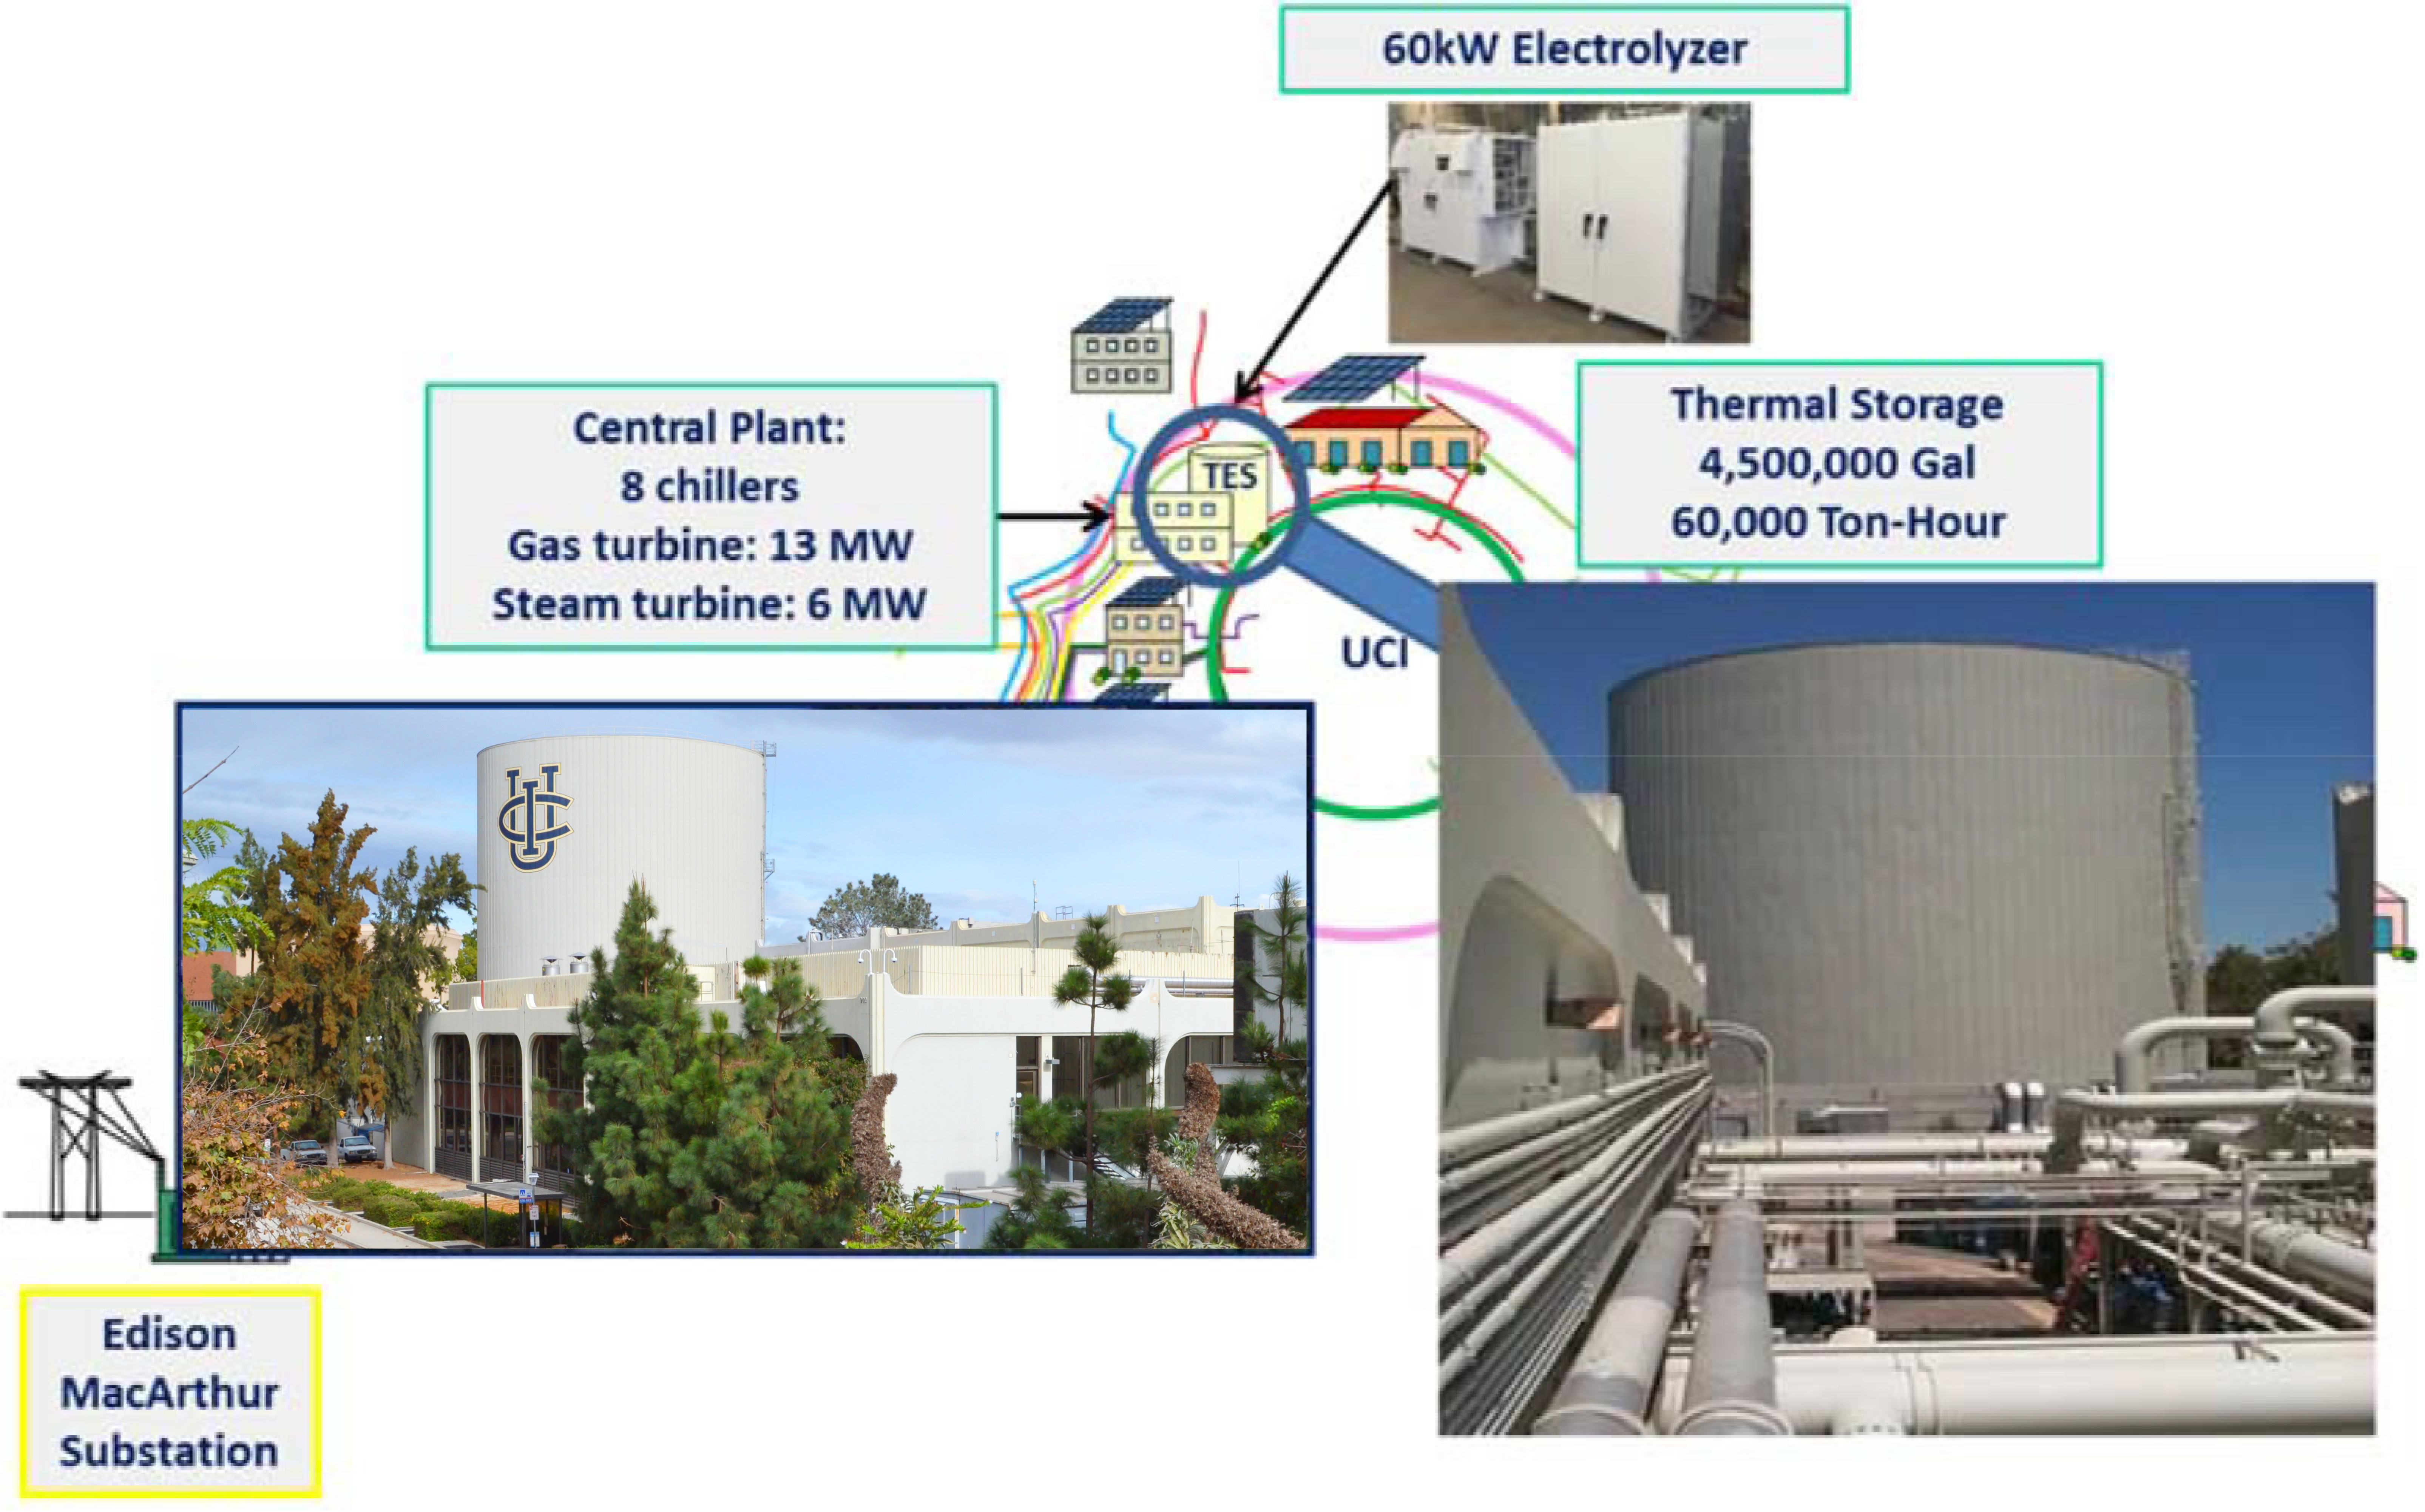
Figure 2: UC Irvine Central Plant
Renewable Power
UCI has 893 kW of fixed panel solar photovoltaic installed on the rooftops of 12 buildings (Figure 3). This system is owned and operated by a third party provider with the electricity purchased by UCI through a power purchase agreement. The capacity factor for these panels, in operation since 2008, was 0.187 in 2012, which is reasonable given the coastal climate. The system provides 1% of the campus electrical needs. An additional 2.8MW of fixed solar PV is scheduled for installation this calendar year.
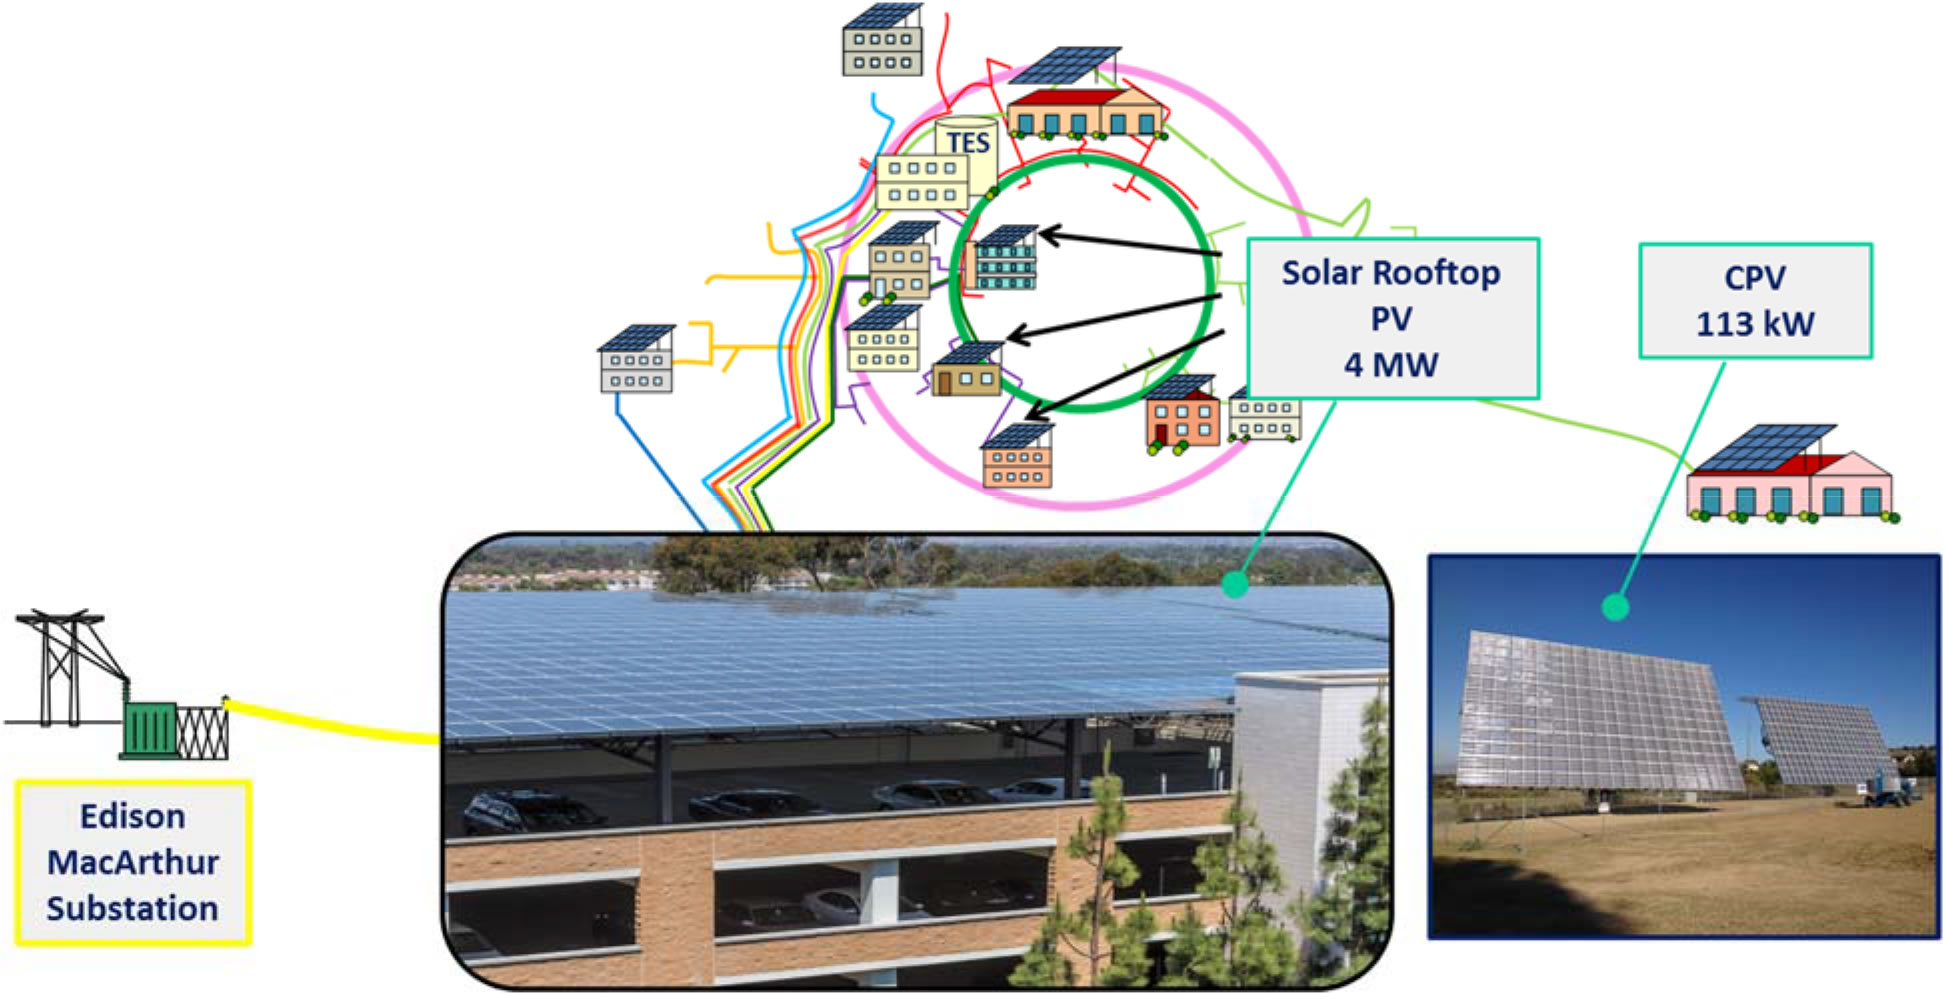
Figure 3: UCI Microgrid Renewable Power
An additional 113 kW of concentrated solar photovoltaic with two-axis tracking was installed in 2012 as part of a research project funded by the California Public Utilities Commission through the California Solar Initiative. This research involves collecting CPV and interconnect data to (1) support design improvements, (2) inform advanced inverter control studies, and (3) develop and evaluate simulation modeling of intermittency on primary circuits.
The campus solar resources are causing the gas turbine to be turned down at times of low electric demand and high solar irradiation. Figure 4 shows UCI Microgrid data at 15 minute resolution for a weekend in May 2012. The gas turbine can be seen having to respond to changes in solar output.
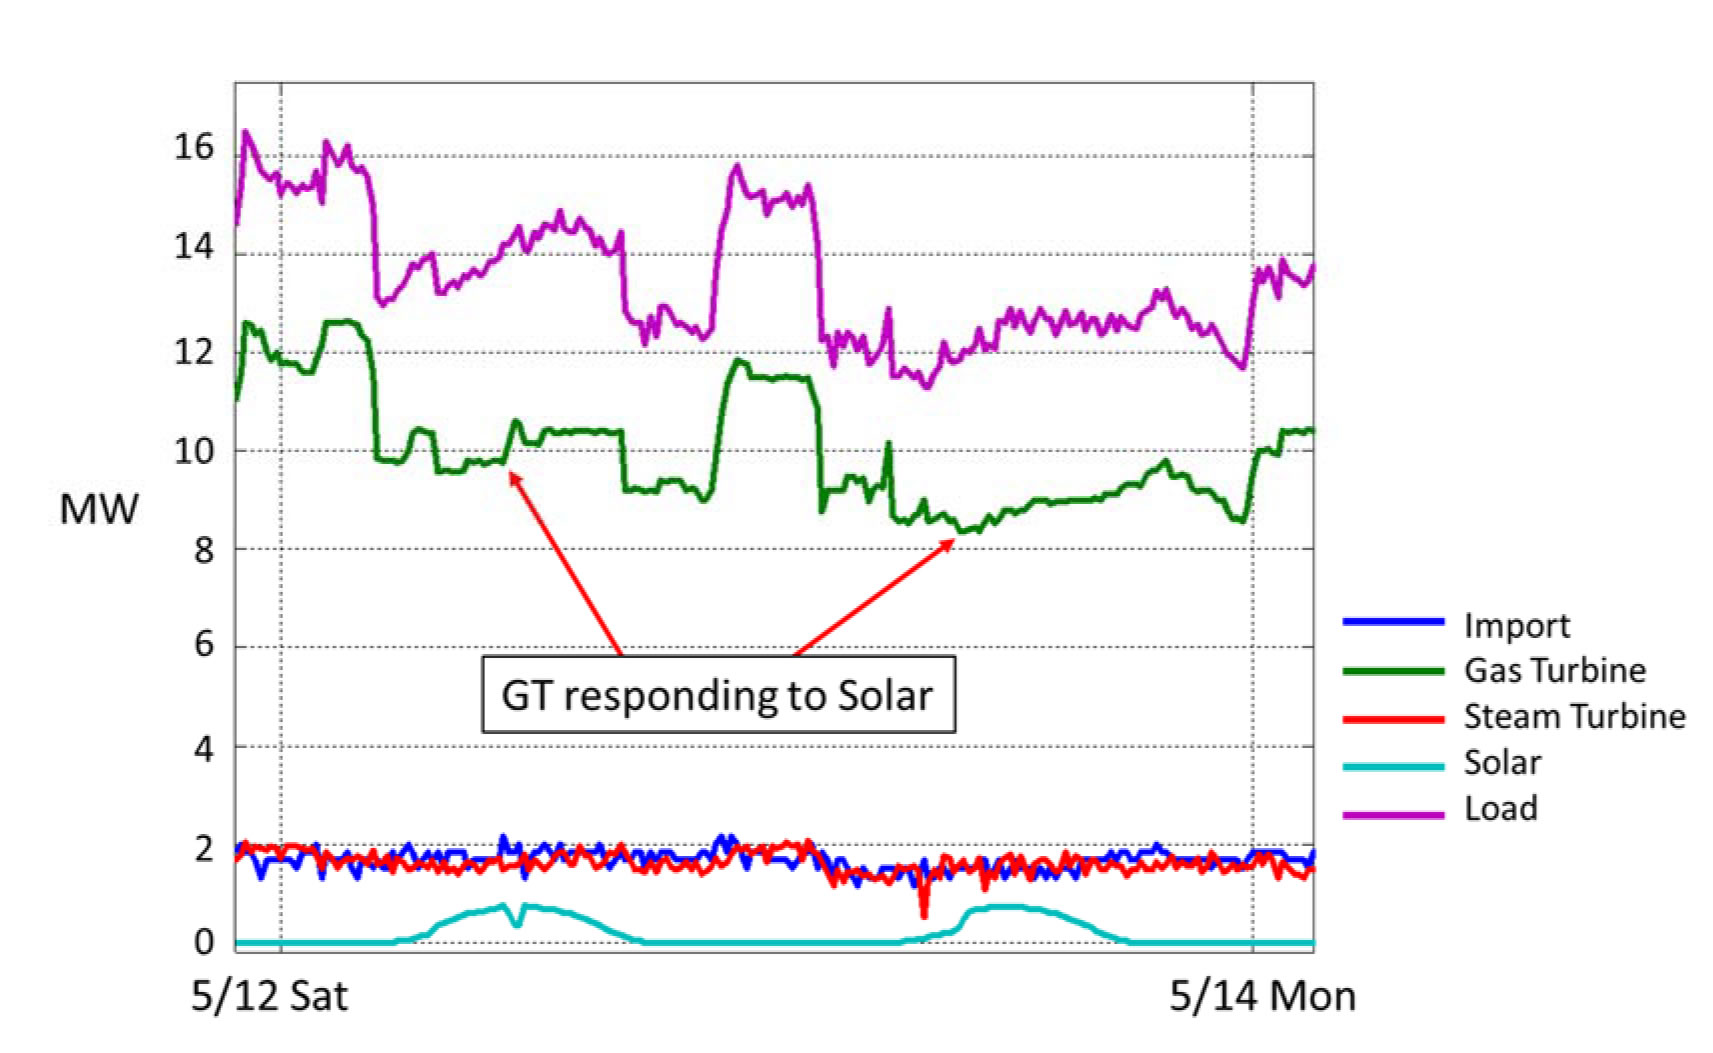
Figure 4: Gas Turbine Responding to Solar Output
Enterprise Energy Management System
At present, APEP and the campus have partnered with MelRoK, LLC to provide an enterprise energy management solution capable of interfacing with UCI Microgrid modeling capabilities and allow real time information to inform the UCI Microgrid model (see UCI Microgrid Model and Simulation Assets section). This solution consists of installing in excess of 100 advanced meters capable of delivering high resolution data to the UCI Microgrid model as well as sub-metering building loads (Figure 5). The locations of these meters have been chosen based on a visibility study performed with the UCI Microgrid model. This solution incorporates existing meters already installed throughout the campus. The data from these meters are presented to the UCI Facilities Management through MelRoK�s EnergiStream
software. MelRoK�s system, equipped with Demand Response capabilities including Auto-Demand Response, provides the UCI Facilities Management team, in conjunction with the UCI Microgrid model, with information necessary to make decisions as more intermittent renewables are installed on the UCI Microgrid in addition to allowing the UCI Microgrid to operate as a smart power and demand response asset for the California Independent System Operator.
Electric Vehicle Charging
The campus has installed 28 Coulomb Technologies level 2 chargers that are open for public use. The APEP also administers the Zero Emission Vehicle Network Enabled Transport (ZEVNET) program (Figure 6). This program currently involves a fleet of 77 advanced vehicles. The vehicles include battery electric vehicles (Scion iQ, Toyota Rav4), plug-in hybrid vehicles (Toyota Prius Plug In), and fuel cell hybrid vehicles (Toyota fuel cell vehicles). Some of the vehicles in the program are used for research purposes only while others are used in a corporate ride-share program.
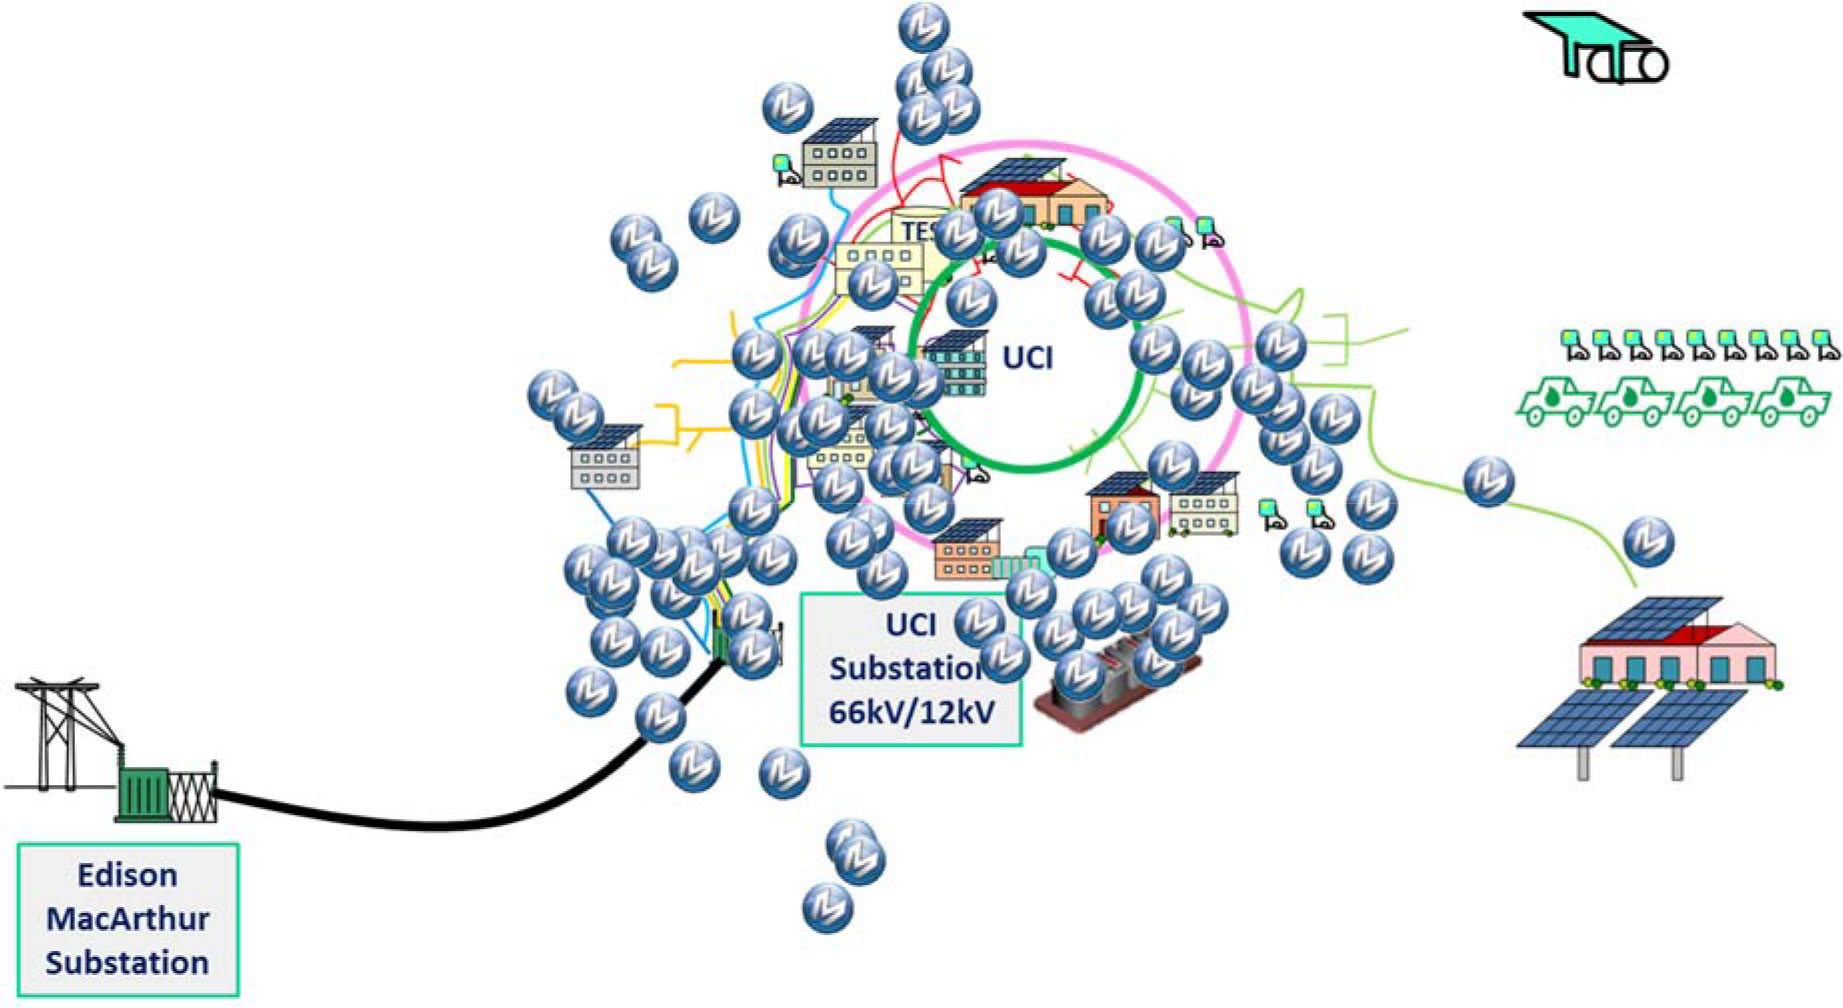
Figure 5: Deployment of MelRok Meters
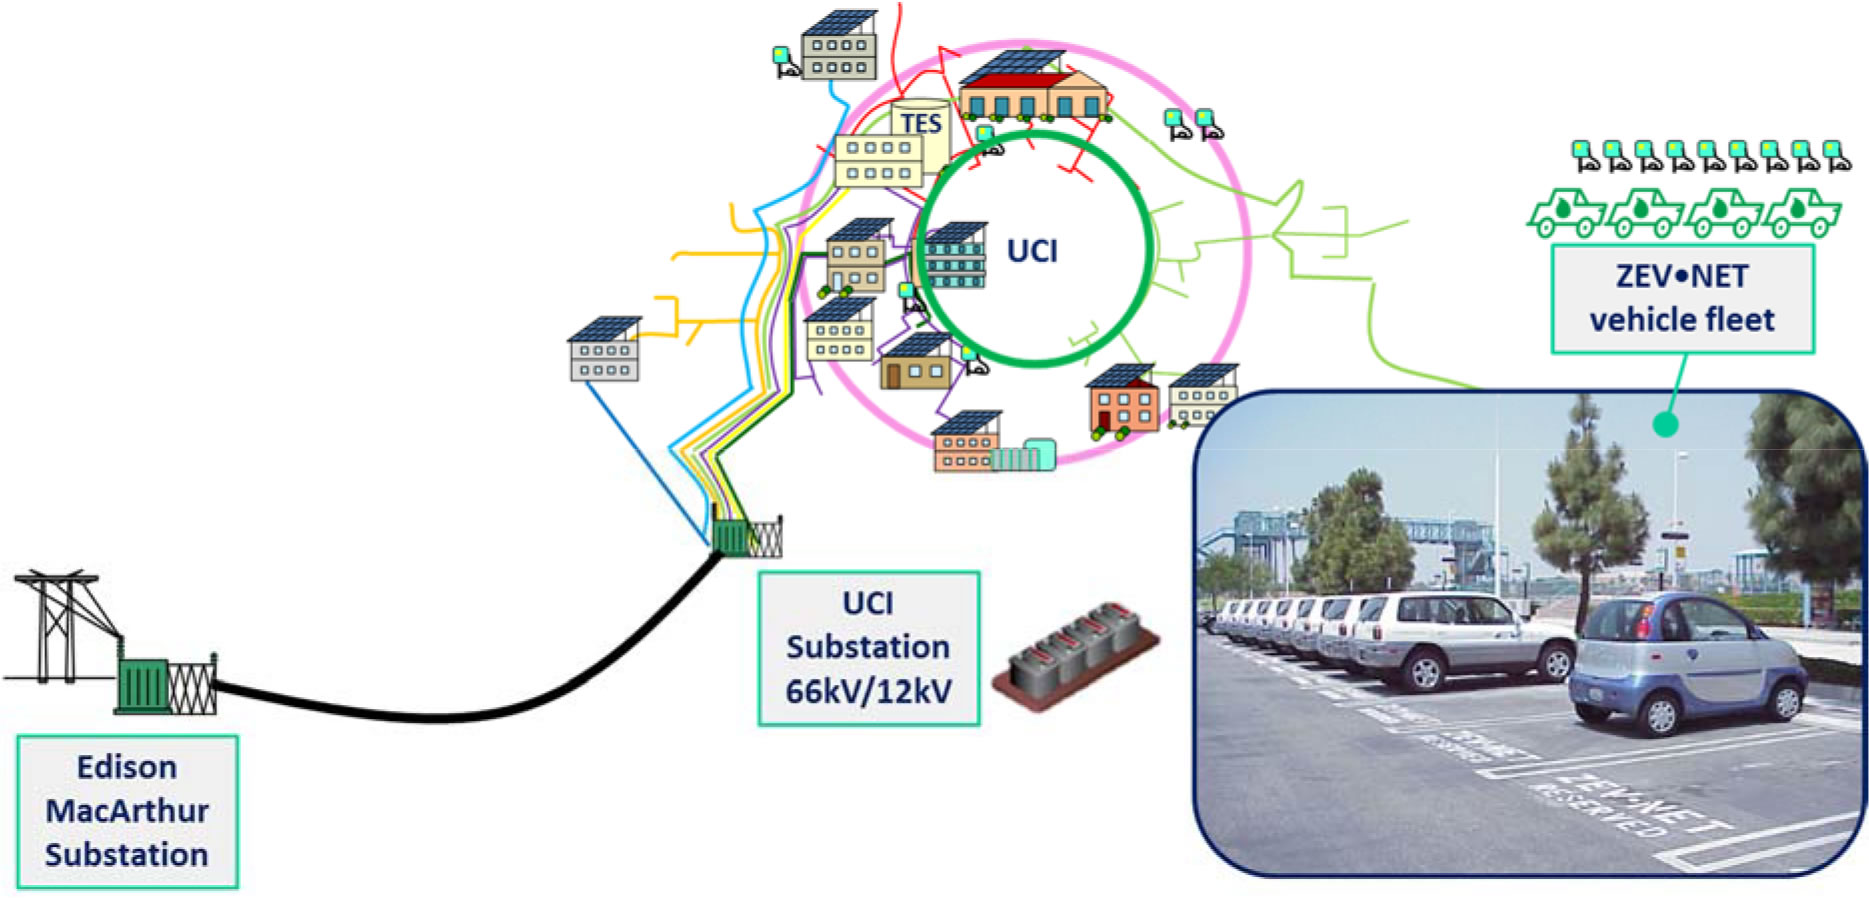
Figure 6: UCI Microgrid Electric Vehicle Charging
Hydrogen Fueling Station
The UCI Hydrogen Fueling Station serves the fueling needs of fuel cell vehicles for several major car manufacturers (Toyota, Honda, GM, Mercedes, Hyundai) and two transit districts operating fuel cell electric buses (UCI Anteater Express, Orange County Transit Authority). The station is administered by APEP and is capable of delivering fills at 35MPa and 70 MPa (Figure 7). The station began operation in 2003 with a capacity of several kg per day. In 2007, the station was upgraded to a capacity of 25kg/day. In 2015, the station was upgraded to a capacity of 180 kg/day.
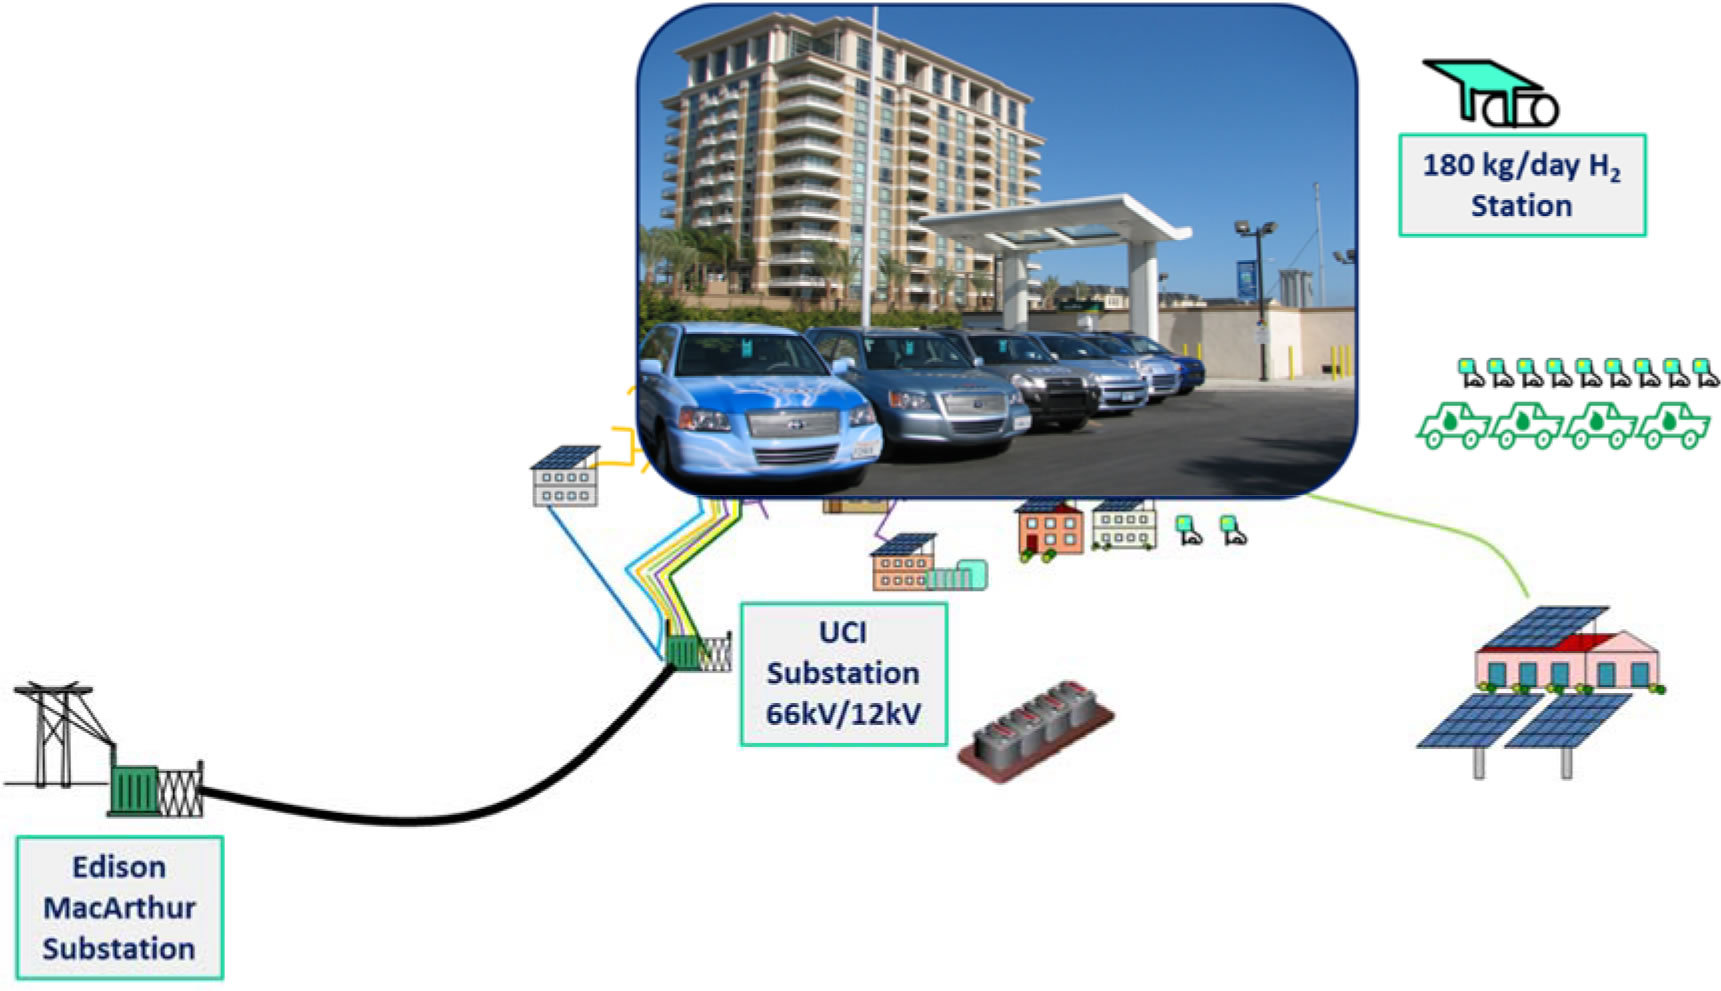
Figure 7: UCI Hydrogen Fueling Station
Energy Efficiency and Demand Response
UCI undertook a deep energy efficiency initiative beginning in 1993 that has lead to a reduction in load exceeding 50% of �business as usual� today (Figure 8). What started as a goal to reduce load by 20% has far exceeded that initial goal, a result that has brought international attention and numerous awards to the campus. Sierra Magazine, for example, has voted UCI as the coolest campus in the country for two years running.
UCI is today participating in the Better Buildings Challenge through the Office of Energy Efficiency and Renewable Energy in the Department of Energy. The program, launched in December 2011 by President Obama, targets a reduction in energy consumed across the campus by 20% by 2020. The program works to match participants with solution providers to enable this challenge to be met. Thus far, UCI has not only met but exceed the targets despite adding one million square feet. In addition, the Natural Sciences II building serves as a showcase for the Better Buildings Challenge in order to highlight the UCI Smart Labs Initiative. UCI also participates in demand response programs through, EnerNOC, a registered demand response provider for Southern California Edison. The campus has nominated 700kW
of demand response so far. This is achieved in various ways involving the steam turbine, HRSG, chiller plant, and thermal energy storage tank. UCI also has plans to implement demand response at the building level using MelRoK�s technology.
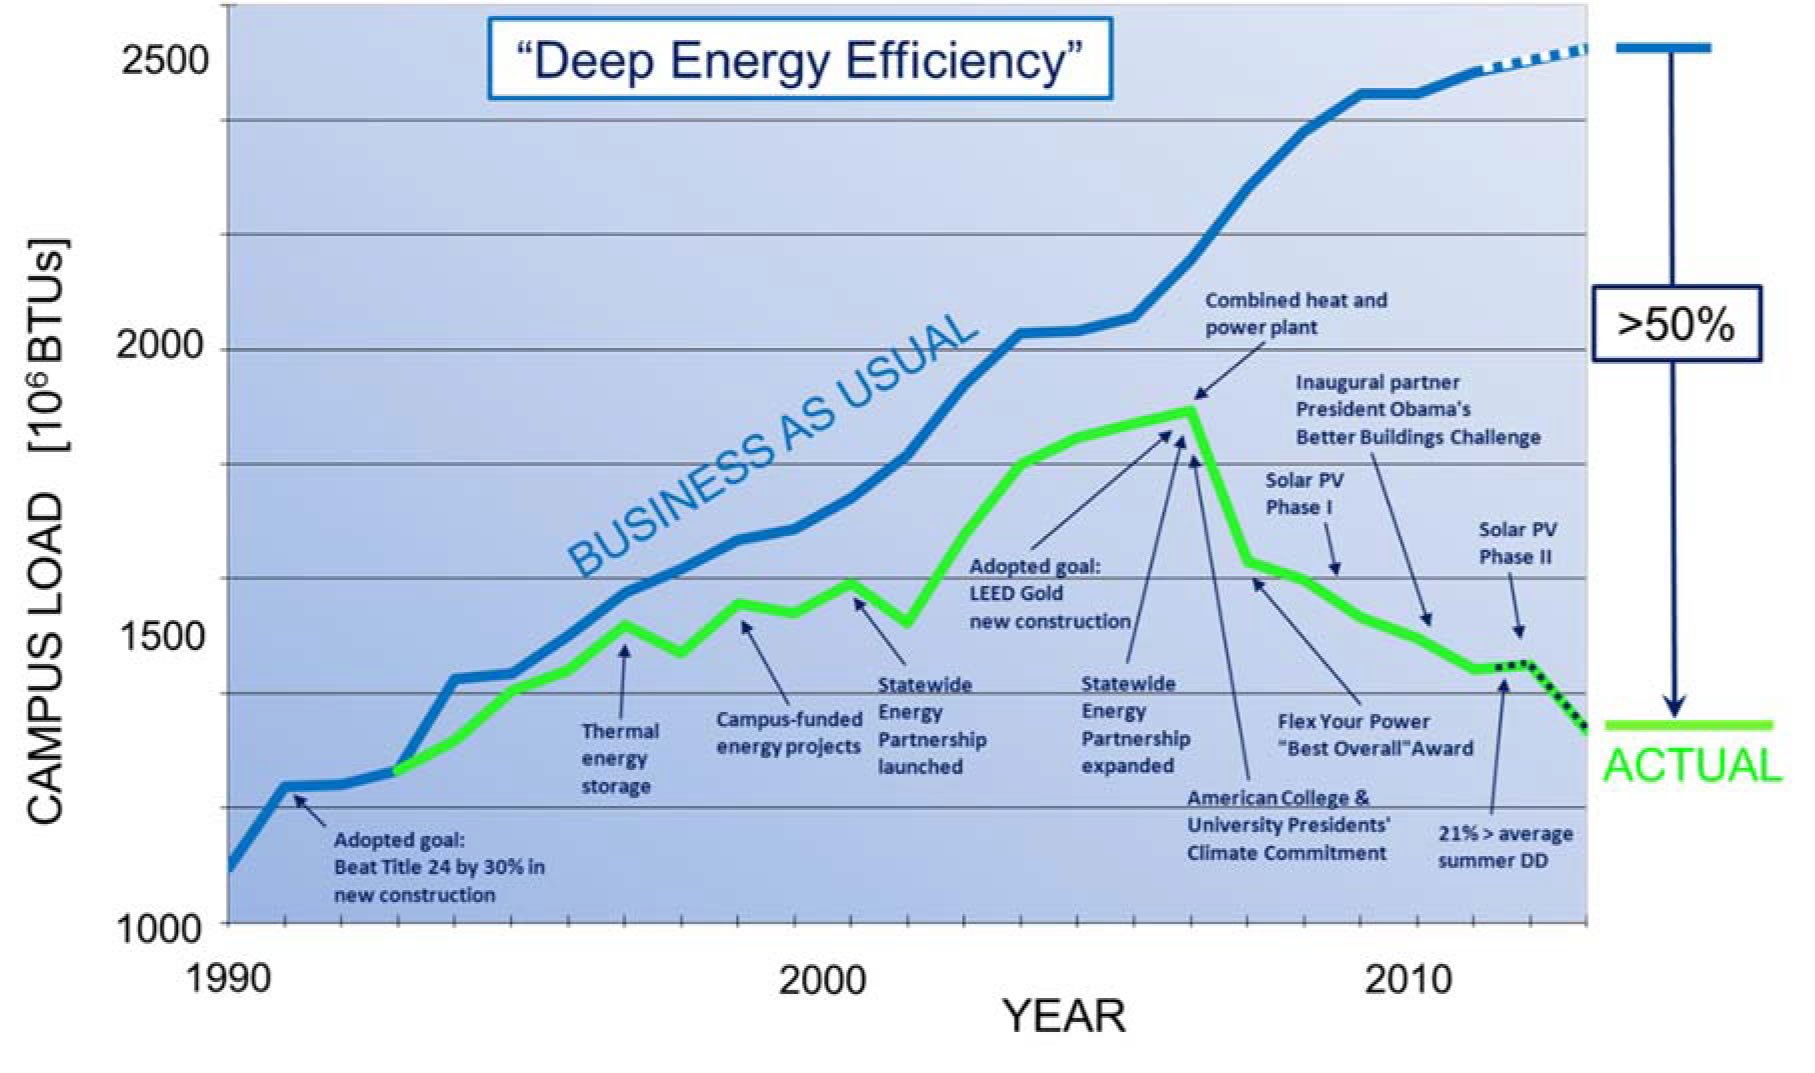
Figure 8: UCI Deep Energy Efficiency Experience
UCI Microgrid Model and Simulation Assets
APEP has collaborated with ETAP (Electrical Transient and Analysis Program), a company that develops electrical transient analysis software, to develop a model of the UCI Microgrid and thereby establish a simulation platform for understanding and managing the effects of high penetrations of localized renewables in the community. The UCI Microgrid model was developed using connectivity information (e.g., line impedance, transformer nameplate) provided by UCI FM and calibrated using the campus energy management and monitoring system. Figure shows the comparison of simulation results from the APEP UCI Microgrid models to measured data. Figure also shows the evolution of the microgrid modeling capabilities. The model was originally developed in Matlab Simulink, but later a transition was
made to the ETAP software for faster computation and better simulation results, as shown in Figure. The model is capable of simulating steady-state and dynamic phenomena as well as temporal events such as PV generation and capacitor switching. Steady-state qualities of interest are real/reactive power flow and the voltage profile across the radial circuits. Dynamic phenomena include power quality (third harmonic distortion and flicker), frequency stability and transients (faults and voltage sags/swells). Calibrating the campus model to measured data ensures the model accurately simulates the system impedance and losses; once calibrated, the model is capable of exploring the effects of future technology such as increased renewable generation, and advanced inverter controls, and energy storage.
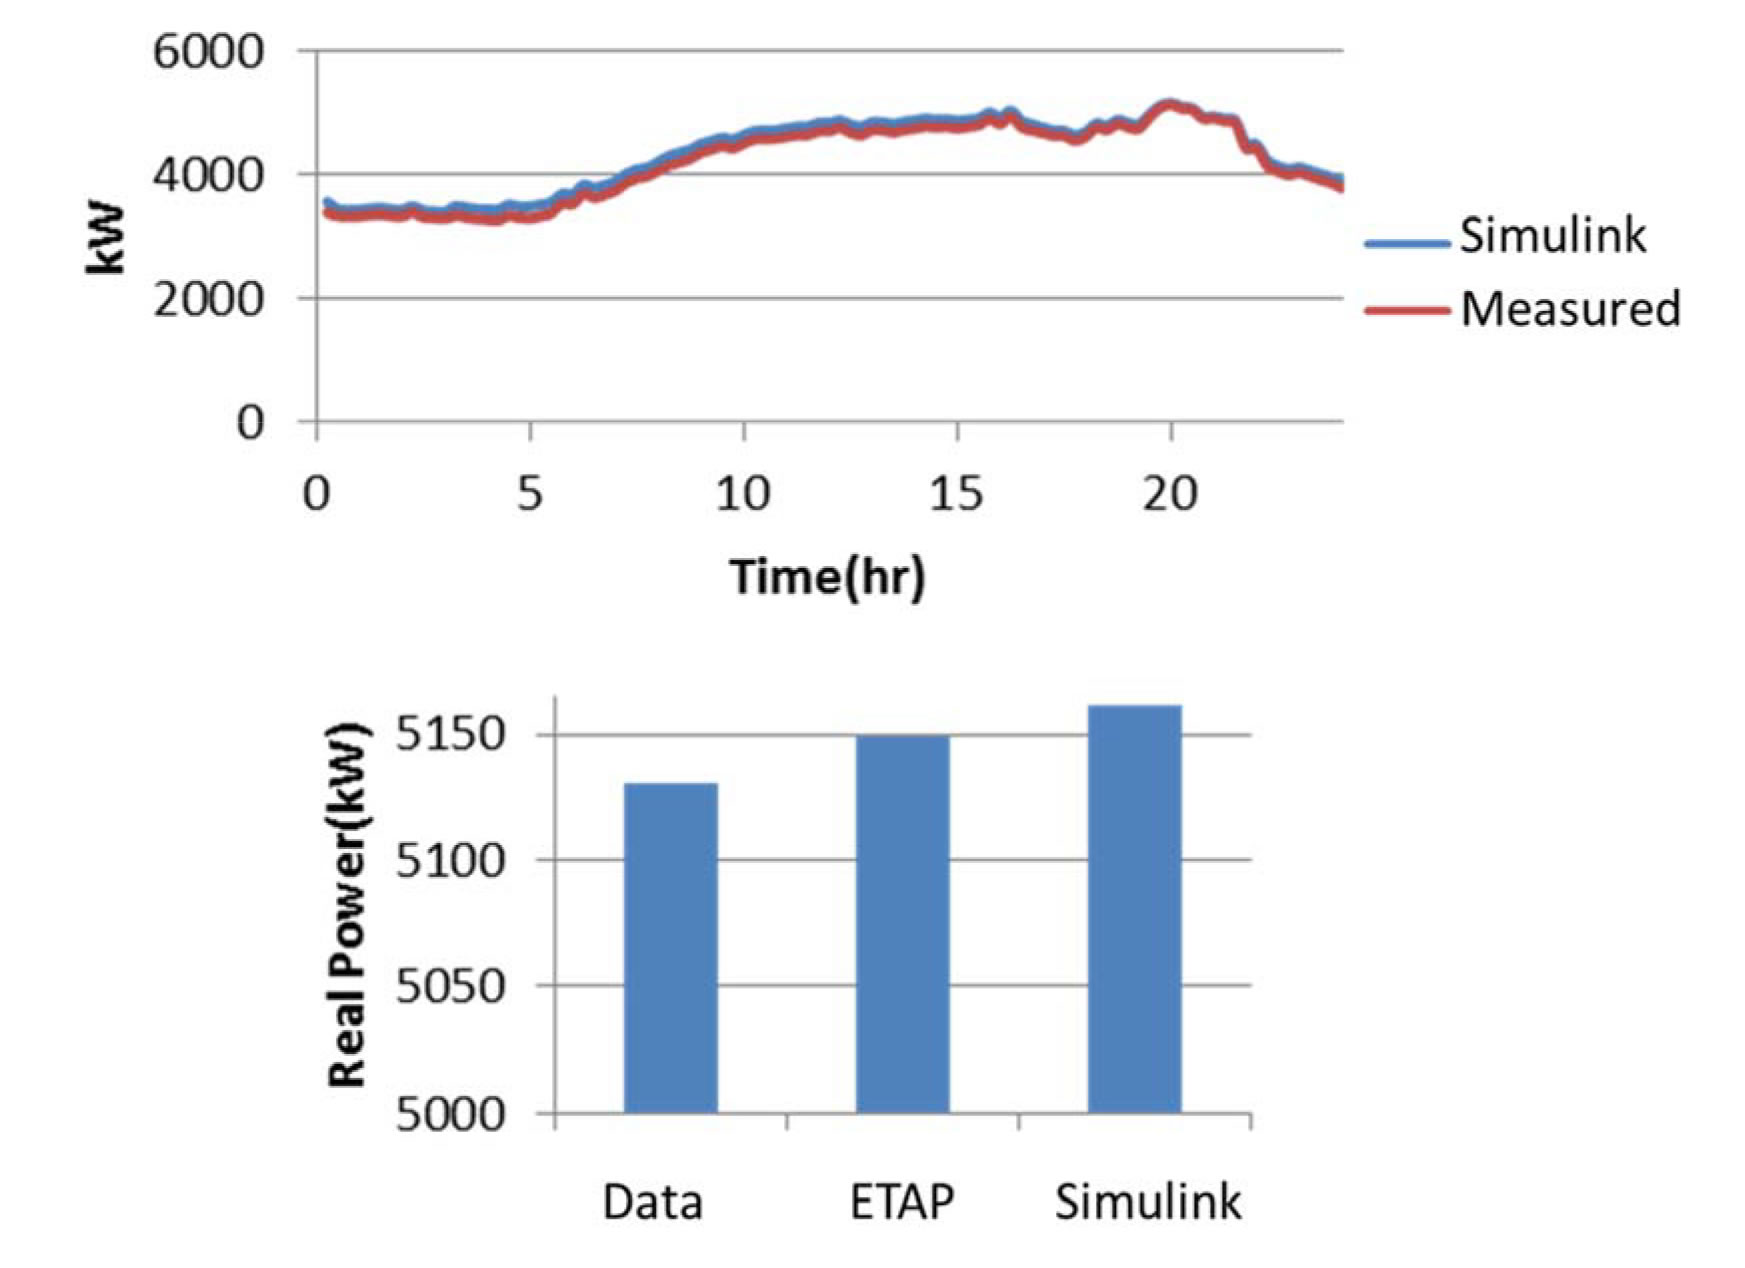
Figure 9: Examples of APEP Microgrid Model Performance
The UCI Microgrid model will also import real time information from the MelRoK system to inform the model for more accurate predictions. It is envisioned that the UCI Microgrid model will be used to manage high penetration of intermittent renewables by allowing the UCI FM to evaluate management options in real time to enable them to have better control of the UCI Microgrid.
Irvine Smart Grid Demonstration
The UCI Microgrid presents unique opportunities to study microgrids in itself, but the UCI Microgrid has the added benefit of being served from same substation (the SCE MacArthur Substation) that anchors the DOE Irvine Smart Grid Demonstration (ISGD) project (Figure 10 10). ISGD, led by SCE, encompasses two smart 12 kV primary circuits and a host of smart grid technologies installed from residences on the secondary circuits to energy storage alternatives on both the secondary and primary circuits, to synchrophasors throughout the Western Electric Coordinating Council (the �Western Grid�). This presents further opportunities to test the use of microgrids in the smart grid future using the UCI Microgrid.
Generic Microgrid Controller Research
Under funding from the U.S. Department of Energy (DOE), APEP is collaborating with Southern California Edison to establish procedures and protocols for the utilization of microgrid resources, identify the policy and standards required to enable and foster the microgrid market, and systematically assess the associated economics. In conjunction with two Irvine companies, ETAP and MelRok, and five �Microgrid Partners,1� APEP is developing the specifications for a �Generic Microgrid Controller (GMC).�
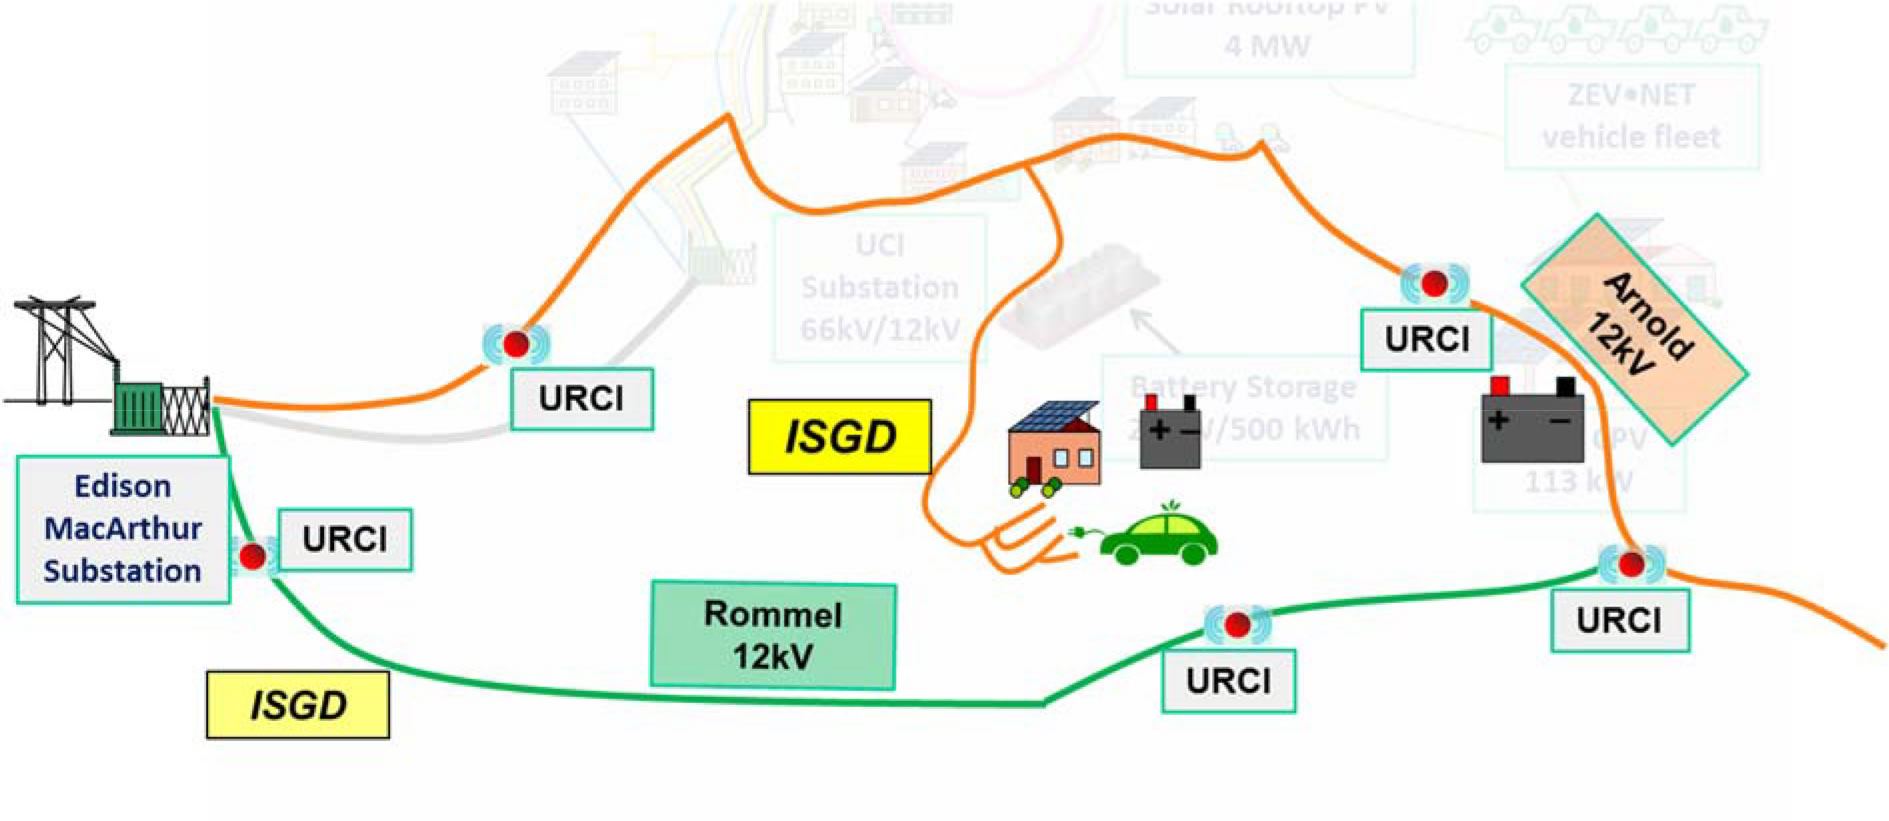
Figure 10: Irvine Smart Grid Demonstration
In addition, the 66kV utility feed to the UCI Microgrid is served from the same distribution substation (the SCE MacArthur Substation) that anchored the DOE Irvine Smart Grid Demonstration (ISGD) project. The principal deliverables of this project are to (1) systematically assess the manner by which a microgrid can serve as an asset to the utility grid and the public, (2) identify and test the �smart demand and power response (SDPR)� capabilities required to meet this goal, (3) categorize the policy and standards needed to enable the market, (4) delineate the business models and overall economics for a matrix of realistic and spanning scenarios associated with the design and operation of a microgrid, and (5) identify the roles of microgrids and necessary protocols in responding to grid emergencies triggered
by natural causes, man-made causes, or accidents.
Summary
The UCI Microgrid represents a special opportunity for testing how microgrids operate internally as well as how they interface with the rest of the future smart grid. The relationship between APEP and UCI FM has enabled the UCI microgrid to become a test bed for different technologies through the development of the UCI Microgrid model, deployment of advanced metering, and various pilot projects. In addition, the same substation that serves the UCI Microgrid also serves the Irvine Smart Grid Demonstration project allowing the UCI Microgrid to be tested in the context of smart grid features. The history of the UCI microgrid is also fundamental to its capability as a test bed. The original design and evolution of the campus provide an attractive platform to support a flexible and robust platform for the deployment and evaluation of the various technologies and circuit configurations emerging in the microgrid future. Table 1 lists the major attributes deployed today on the UCI Microgrid.
1Port of Los Angeles, Port of Long Beach, Irvine Ranch Water District, UCI Medical Center.
Table 1 UCI Microgrid Attributes
| Attributes |
Description |
| Substation |
69kV to 12kV using two 15 MVA transformers. ISGD syncrophasors at MacArthur Substation. |
| Cogeneration Plant |
13.5 MW natural gas fired gas turbine. Heat Recovery Steam Generator with Duct Burner. 6 MW steam turbine. |
| Enterprise Energy Management System |
MelRok, LLC EnergiStream system. Capable of sub-metering building loads and interfacing with UCI Microgrid model to provide real time data. |
| Central District Heating/Cooling |
Maintains 5 million square feet of conditioned space as well as high temperature water to make steam for laboratory use, domestic hot water, and industrial hot water |
| Thermal Energy Storage |
4.5 MM gallons. 65% load shifting on average. 60,000 ton-hours of chilling storage when fully charged. |
| Electric Vehicle Charging |
5 smart chargers on campus. 15 BEVs deployed. 10 PHEVs deployed. |
| Renewable Power |
Fixed PV on 11 campus rooftops for 895kW total. 113 kW dual axis tracking concentrated PV. 2.8 MW additional fixed PV planned for 2013. |
| Energy Efficiency |
Building Retrofits. 10% load reduction despite adding one million square feet. UCI has received national recognition for its energy efficiency work on laboratories. |
| Hydrogen Fueling Station |
Capable of delivering 180 kg-H2/day. Can fill at 350 bar and 700 bar. |
| Advanced Building Level Combined Cooling Heating and Power |
300 kW Molten Carbonate Fuel Cell (FuelCell Energy) integrated with 40 ton absorption chiller (Yazaki) and thermal energy storage tank to serve needs of Multi-Purpose Science and Technology Building. |
| Demand Response |
Nomination of 700 kW through EnerNOC. Multiple strategies using the TES tank, chillers, HRSG and steam turbine. |
| UCI Microgrid Model |
Developed in the Electrical Transient and Analysis Program (ETAP). Will provide information to the UCI FM when operating the microgrid. |